0

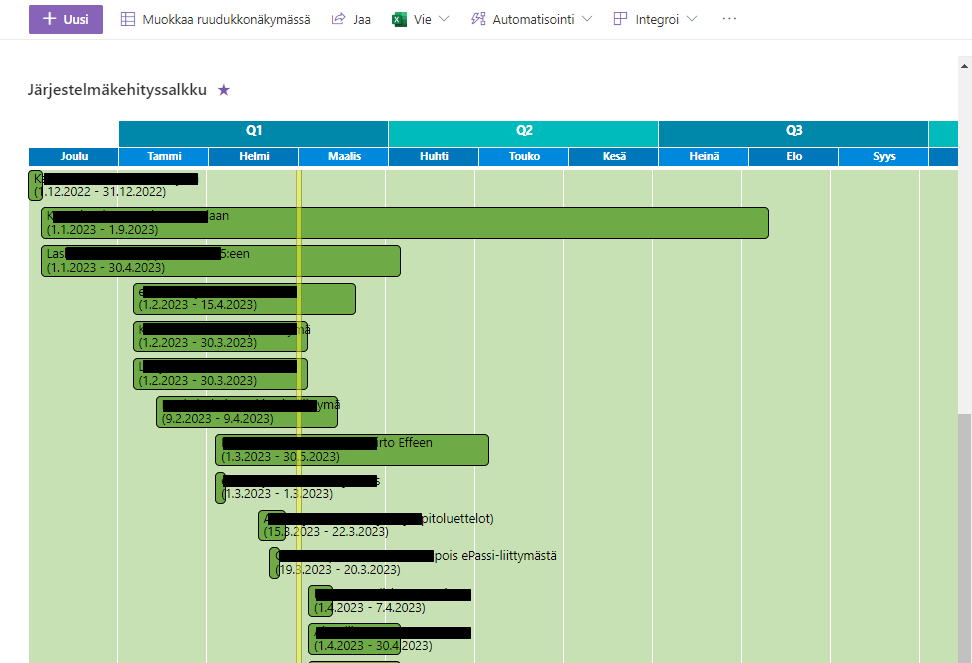
I have built a roadmap view of projects, which follows the general design principles of building gantt charts with sharepoint lists and views (one example is Let's create a GANTT chart by Federico Sapia). Our problem: we can't think how to make the custom header row sticky vertically (srolling down).

enter image description here

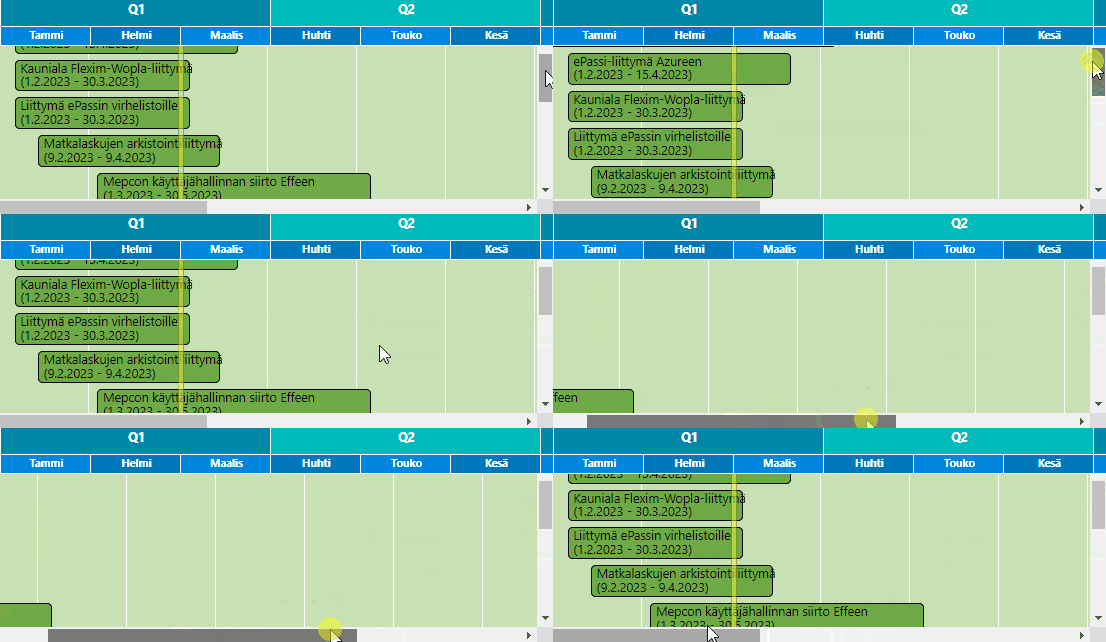
The header row is "a little" sticky, but only withing the constrains of the row it is drawn in: enter image description here
I think the problem is that since the header div is created inside the rowFormatter, the parent container for the header div is the row. And that restricts the sticky header from moving outside of parent row's borders.

json root
    rowFormatter
        child 1 - draw header (but only if we're in row number #0)
        child 2 - draw data row

It is my understanding that when using rowFormatter, it must be the top parent and cannot have sibling elements. In that case, is it even possible to have a sticky row with this approach?

white box

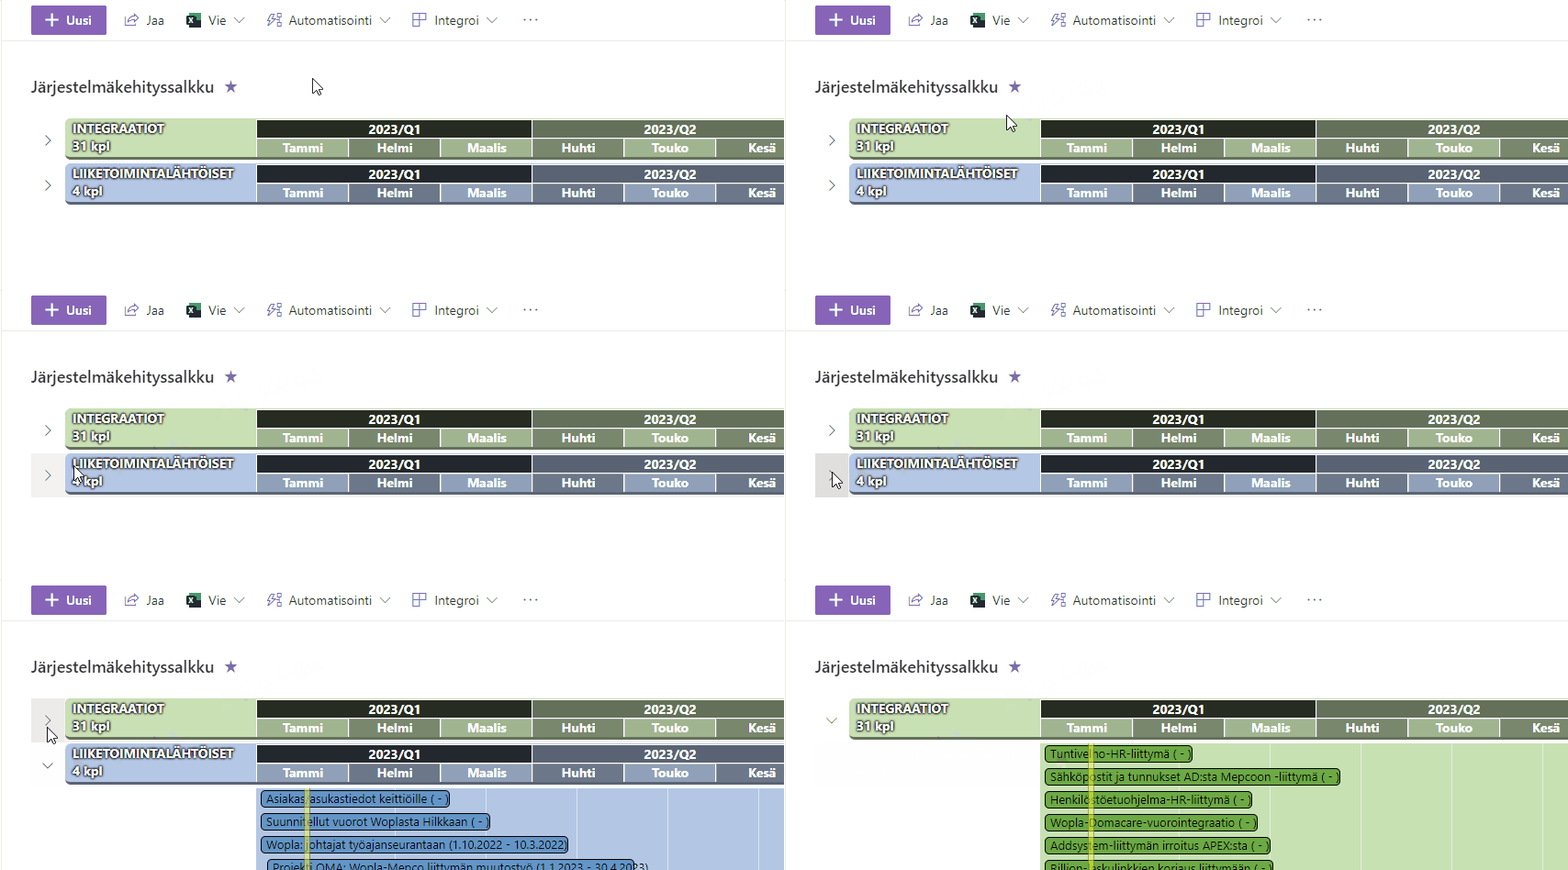
Additionally: using "position: fixed" I could achieve the experience of a floating header row but "fixed" means that the row would not scroll horizontally either - which is a problem because the timeline would break, month would not match the column:

enter image description here


How to recreate the issue


  1. Create a list, you only need a title column

  2. Insert ~10 rows, just so that you have something to scroll when viewing the data

  3. Create a List view and use this JSON as formatting. I stripped out everything irrelevant (I hope):

    {
      "$schema": "https://developer.microsoft.com/json-schemas/sp/v2/row-formatting.schema.json",
      "hideColumnHeader": true,
      "hideSelection": true,
      "rowFormatter": {
        "elmType": "div",
        "style": {
          "display": "block"
        },
        "children": [
          {  
            "elmType": "div",
            "txtContent":"STICKY HEADER: Should stay visible when scrolling",
            "style": {
              "top": "90px",
              "height": "50px",
              "display": "=if(@rowIndex==0,'flex','none')",
              "position": "sticky",
              "background-color": "silver"
            }
          },
          {
            "elmType": "div",
            "txtContent": "='List item #' + (@rowIndex+1)+': '+[$Title]",
             "style": {
               "height": "80px",
               "border-bottom": "1px solid black",
               "padding":"50px 0px 0px 0px"
             }
           }
         ]
       }
     }
    
  4. You should be able to observe that the sticky header div is not sticking

2
  • can you share the JSON code of your sample and the steps required to reproduce it? - comment by Federico Sapia Commented Mar 29, 2023 at 17:49
  • I'm not able to highlight your username (perhaps as you just recently joined), but I updated my post with a "How to recreate the issue" section. Commented Mar 29, 2023 at 20:25

2 Answers 2

1

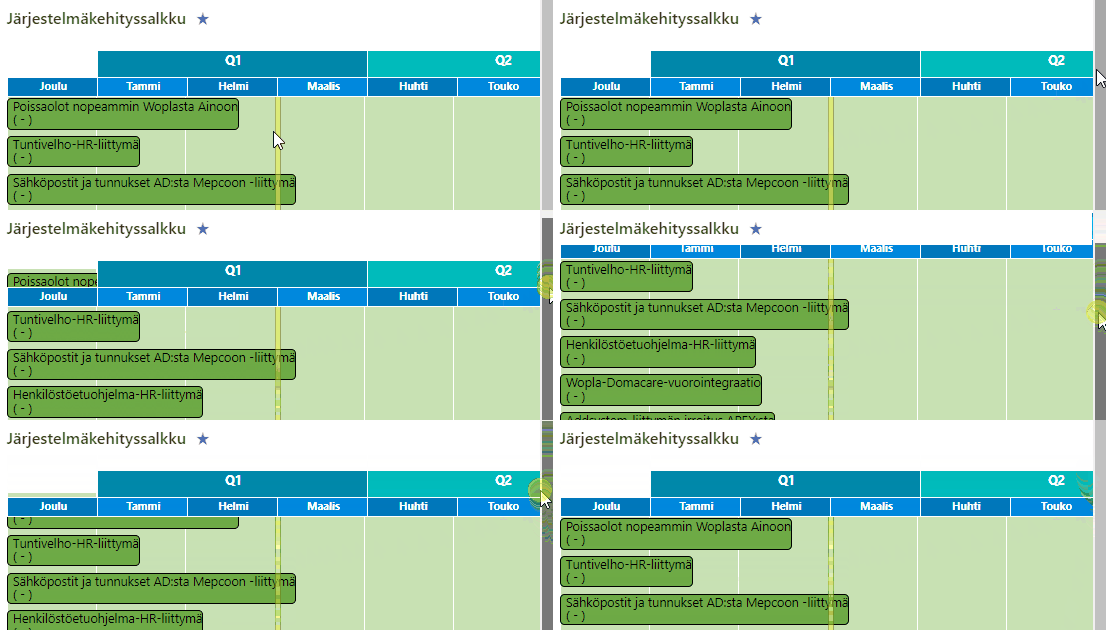
Answering to myself, I chose an alternative approach to my problem: invasively customizing the group headers. I moved the roadmap header row into the group header section.

This way the roadmap header row at least repeats itself above each group. But it would still be cool if someone figures out how to get a sticky header row work with a rowFormatter approach.

Edited: This is the customized JSON for the group headers I used. It is not generalized so it references some fields unique to my list:

{
  "$schema": "https://developer.microsoft.com/json-schemas/sp/v2/row-formatting.schema.json",
  "hideSelection": true,
  "hideColumnHeader": true,
  "groupProps": {
    "hideFooter": true,
    "headerFormatter": {
      "elmType": "div",
      "style": {
        "display": "flex",
        "box-sizing": "border-box",
        "padding": "4px 8px 5px 8px",
        "border-radius": "6px",
        "border-bottom": "3px solid rgba(0,0,0,0.5)",
        "vertical-align": "top",
        "overflow": "hidden",
        "margin": "1px 4px 4px 1px",
        "width": "2600px",
        "height": "45px",
        "background-color": "=if(@group.fieldData == 'Integraatiot','#c8e1b4','#b4c8e6')",
        "font-weight":"bold"
      },
      "children": [  
        {
          "elmType": "div",
          "children": [
            {
              "elmType": "div",
              "txtContent": "= toUpperCase(@group.fieldData.displayValue)+'\n'[email protected] + ' kpl'",
              "style": {
                "display": "flex",
                "position": "absolute",
                "top": "0px",
                "width": "200px",
                "height": "50px",
                "color": "#ffffff",
                "text-shadow": "0px 0px 3px #000000,0px 0px 3px #000000,0px 0px 3px #000000"
              }
            },
            {
              "elmType": "div",
              "forEach": "quarter in split('0-2023/Q1,1-2023/Q2,2-2023/Q3,3-2023/Q4,4-2024/Q1,5-2024/Q2,6-2024/Q3,7-2024/Q4',',')",
              "txtContent": "=substring([$quarter],indexOf([$quarter],'-')+1,10)",
              "style": {
                "position": "absolute",
                "border-right": "3px solid rgba(255,255,255,1)",
                "top": "0px",
                "height": "20px",
                "left": "=245+(Number(substring([$quarter],0,indexOf([$quarter],'-')))*300)+'px'",
                "background-color": "=if((Number(substring([$quarter],0,indexOf([$quarter],'-')))%2==0,'rgba(0,0,0,0.8)','rgba(0,0,0,0.5)')",
                "color": "#ffffff",
                "width": "300px",
                "border": "1px solid #ffffff",
                "text-align": "center",
                "font-size": "14px"
              }
            },
            {
              "elmType": "div",
              "forEach": "month in split('1-Tammi,2-Helmi,3-Maalis,4-Huhti,5-Touko,6-Kesä,7-Heinä,8-Elo,9-Syys,10-Loka,11-Marras,12-Joulu,13-Tammi,14-Helmi,15-Maalis,16-Huhti,17-Touko,18-Kesä,19-Heinä,20-Elo,21-Syys,22-Loka,23-Marras,24-Joulu',',')",
              "txtContent": "=substring([$month],indexOf([$month],'-')+1,10)",
              "style": {
                "top": "20px",
                "position": "absolute",
                "border-right": "3px solid rgba(255,255,255,1)",
                "height": "20px",
                "left": "=145+(Number(substring([$month],0,indexOf([$month],'-')))*100)+'px'",
                "background-color": "=if((Number(substring([$month],0,indexOf([$month],'-')))%2==0,'rgba(0,0,0,0.4)','rgba(0,0,0,0.2)')",
                "color": "#ffffff",
                "width": "100px",
                "border": "1px solid #ffffff",
                "text-align": "center"
              }
            }
          ]
        }
      ]
    }
  },

enter image description here

2
  • You can add the complete JSON you used in your answer here to help others in future. Commented Mar 30, 2023 at 7:17
  • 1
    Fair enough, I updated my answer. I often hesitate because whatever I finally get to work, is not"nice and clean" and I'm frankly embarrassed to publish it. Commented Mar 30, 2023 at 9:16
0

I find your group solution very smart and handy. Microsoft Lists grouping is often underrated but your sample is pretty well done. Feel free to share it in pnp GitHub too.

Your Answer

By clicking “Post Your Answer”, you agree to our terms of service and acknowledge you have read our privacy policy.

Not the answer you're looking for? Browse other questions tagged or ask your own question.