1

I have really strange problems with debuging sharepoint solution. Sometimes i cannot debug sharepoint webparts. Now i have such situation and nothing helps. I tried to restart computer\recycle pools\iisreset enter image description here Problem that when i am attaching to processes visual studio starts to really slowly loads some symbols. enter image description here
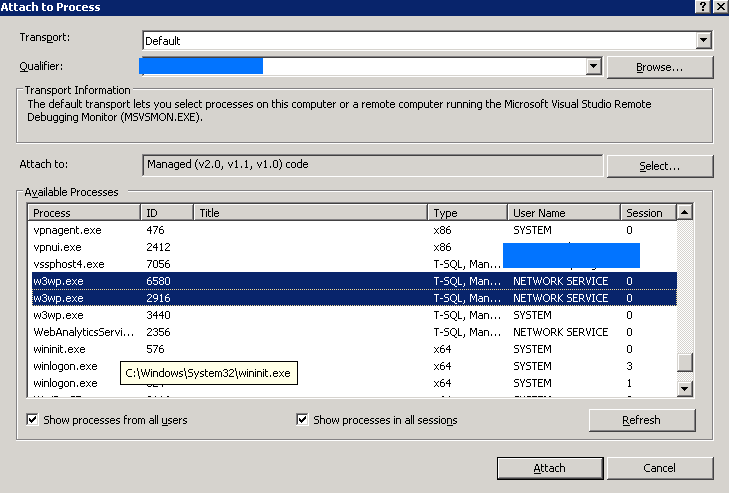
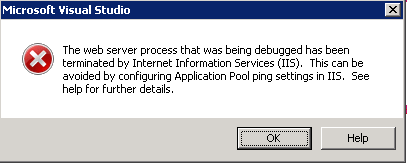
and after 10 minutes i have message:

enter image description here

What can cause such problems? I also tried to set huge timeouts and its not helps either.

Studio running under admin rights.

Also ping was changed and tested in both 'enabled' and 'disabled':
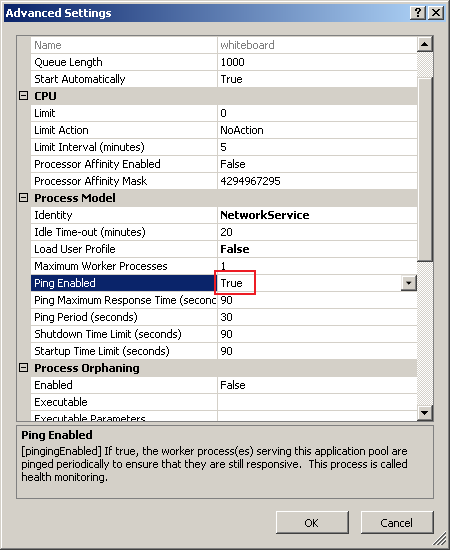
enter image description here

And without results.

1 Answer 1

1

This is usually caused by IIS Health Monitoring thinking that the web service that you are debugging has locked up and it needs to be restarted. Check out this post for more details.

5
  • I tried this. But in post author had timeouts and i cannot even attach to processes.
    – Ievgen
    Commented Apr 26, 2012 at 15:09
  • 1
    How much RAM is on your dev machine and are you running your SQL server on that machine as well?
    – Dave Wise
    Commented Apr 26, 2012 at 15:16
  • Yes, on the same machine. I have 8GB or RAM
    – Ievgen
    Commented Apr 26, 2012 at 16:15
  • 1
    I assume a multi-core processor as well. You might want to restart SQL once before diving into any serious debugging sessions as it has a tendency to eat RAM.
    – Dave Wise
    Commented Apr 26, 2012 at 16:33
  • 1
    Also, it is helpful if you warm up the site prior to debugging it by loading a page that contains your custom code in the browser prior to attaching the debugger
    – Dave Wise
    Commented Apr 26, 2012 at 16:33

Your Answer

By clicking “Post Your Answer”, you agree to our terms of service and acknowledge you have read our privacy policy.

Not the answer you're looking for? Browse other questions tagged or ask your own question.