2

I am using vs.net 2010 and having trouble debugging a feature activation. I have tried rebooting, reattaching etc. I have attached to w3wp processes (and vshost if it is available) and yet the debug points are not hit.

Any ideas on how to get vs.net to kick in? thx

1
  • It works sometimes and sometimes it doesn't. Yes, it is not the release/debug build thing, I have looked at that.
    – dave
    Commented Sep 24, 2010 at 19:01

4 Answers 4

3

If you are using VS2010 to deploy the feature, try changing the Active Deployment Configuration in the Project Properties\SharePoint tab to "No Activation". enter image description here
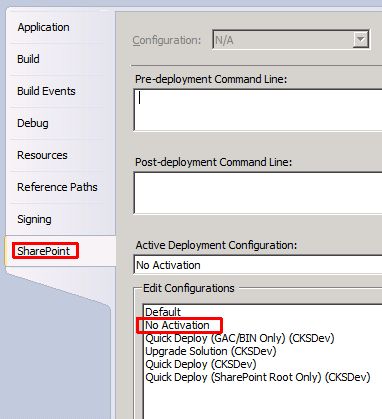
When you run the application with debugging (F5), it will deploy the package and activate it before the debugger attaches to the process.

Turning off automatic activation will allow you to attach to the process. Then you manually go into the feature activation page and activate the feature. When you do it in this order, you should be able to break within the Feature activation code.

1
  • This is what I do most of the time. A quick way to jump into debugging if it isn't going to be needed a lot is to press F5 and then deactive the feature and activate it again -- the breakpoints should be hit. Of course, this only works if the event receiver does not have any side effects.
    – David Culp
    Commented Oct 4, 2011 at 18:38
1

Are you having sufficient right on the machine where you are trying to debug? also enure you are not trying to debug in release mode.

1
  • Trying to debug a "Release" dll caught me out before. Ensure "Debug" is set for the build type, and a .PDB is generated in your build folder.
    – James Love
    Commented Sep 24, 2010 at 17:13
1

We develop using the built in VS 2010 SharePoint support. Feature Activation seems to run before studio has attached the debugger.

I usually add a Debugger.Break() to the feature activation code and then Deploy the solution. (Not Debug)

During deployment the debug dialog pops up and I can then attach to the running Studio and debug normally

Be sure to remove the Debugger.Break() before you ship.

0

I've seen this happen to myself after many repeated updates to the solution in question. I found that occasionally remove the solution all together, then redeploying tends to clear this up. Not sure why it happens though.

Your Answer

By clicking “Post Your Answer”, you agree to our terms of service and acknowledge you have read our privacy policy.

Not the answer you're looking for? Browse other questions tagged or ask your own question.