Following this Article
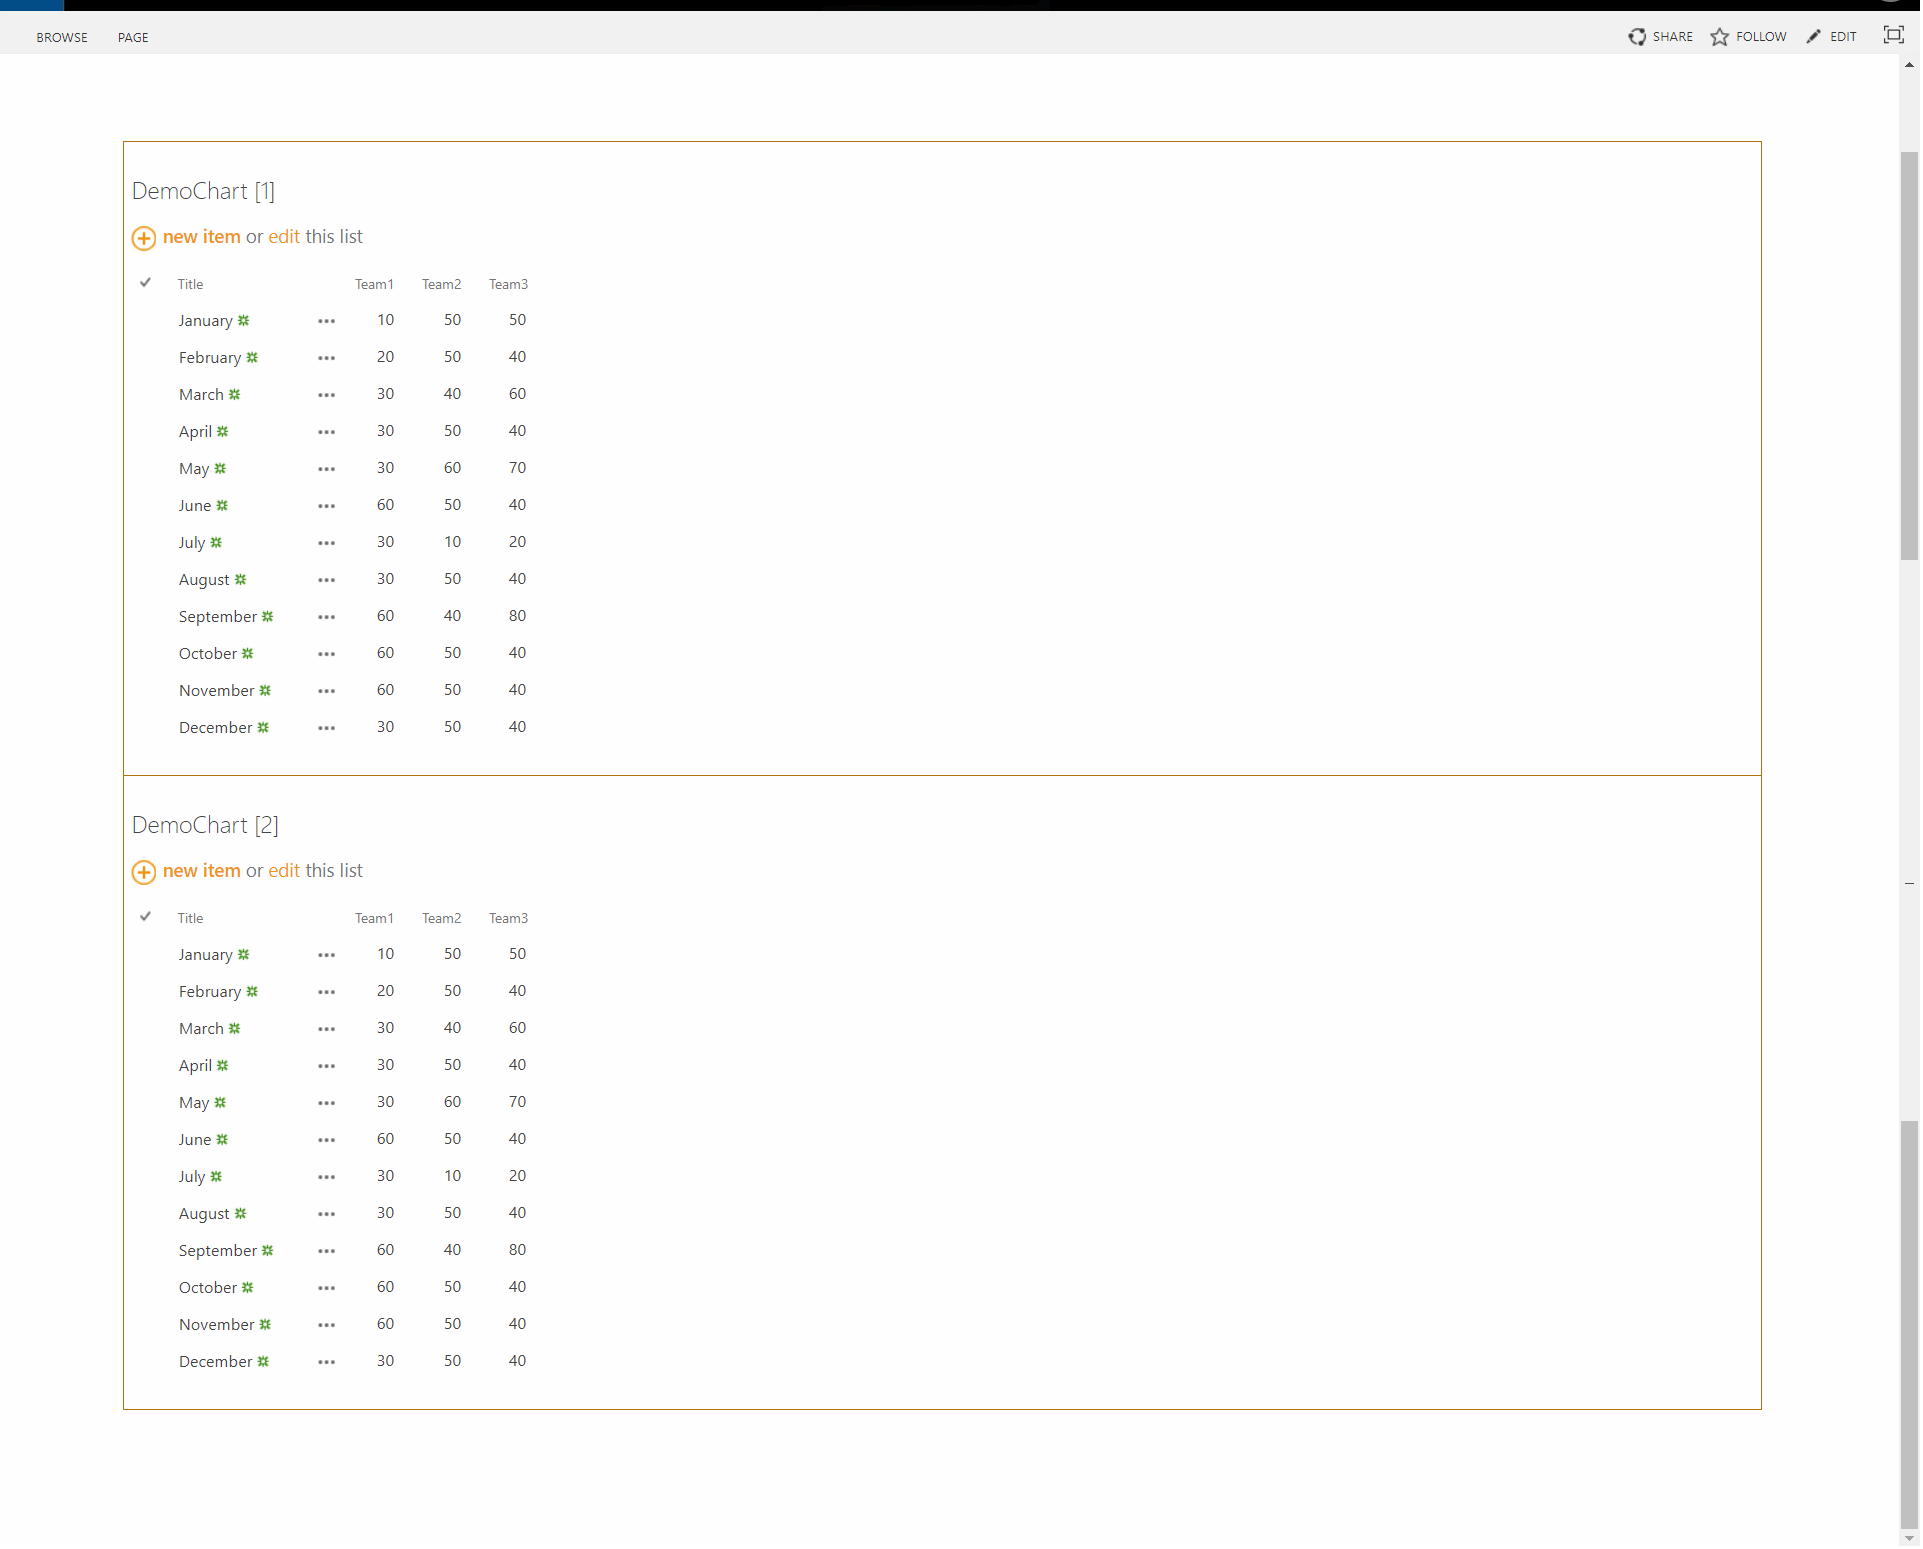
Scenario: To create charts. Using chart.js + jquery + Demochart.js file I have modified using the one given in article. I have two list view webparts in same page. So I apply these JS links to first List view webpart it works but the second list view does not show. I use first list view webpart's View ID (taken from SPdesigner) to distinguish between webparts...so JSlinks affect only the first one.
Am I using Demochart.js the right way?
Code of Demochart.js:
// Declare the variables.
var sitesChart = sitesChart || {};

sitesChart.Colors = ['#1BA1E2', '#E51400', '#339933','#56348E'];

sitesChart.ChartTitle =[];
sitesChart.ChartT1 = [];
sitesChart.ChartT2 = [];
sitesChart.ChartT3= [];


sitesChart.Desc = '';

// Override the rendering.
sitesChart.FieldRenderSetup = function (ctx) {
    var override = {};
    override.Templates = {};
    override.Templates.Header = sitesChart.CustomHeader;
    override.Templates.Item = sitesChart.CustomItem;
    override.Templates.Footer = sitesChart.CustomFooter;

    SPClientTemplates.TemplateManager.RegisterTemplateOverrides(override);
};


sitesChart.CustomItem = function (ctx) {
        var str = ctx.view.toString();

        //Using Webpart view id to distinguish between webparts
        if(ctx.view === "{3FE32257-65DA-467F-919B-16B742BA932E}"){
            sitesChart.ChartTitle.push(ctx.CurrentItem.Title);//columns names
            sitesChart.ChartT1.push(parseInt(ctx.CurrentItem.Team1));//columns names
            sitesChart.ChartT2.push(parseInt(ctx.CurrentItem.Team2));//columns names
            sitesChart.ChartT3.push(parseInt(ctx.CurrentItem.Team3));//columns names
        }
        return '';
}


sitesChart.CustomHeader = function (ctx) {
    return "<canvas id='lineChart' width='700' height='400' style='float:left;margin-right:20px;'></canvas>";
}

// Override the footer.
sitesChart.CustomFooter = function () {

    var data = {
        labels: sitesChart.ChartTitle,
        datasets: [
        {
            label: "Team1",
            fill: false,
            borderColor: sitesChart.Colors[0],
            pointBorderColor: sitesChart.Colors[0],
            pointBackgroundColor: "#fff",
            data: sitesChart.ChartT1
        },
        {
            label: "Team2",
            fill: false,
            borderColor: sitesChart.Colors[1],
            pointBorderColor: sitesChart.Colors[1],
            pointBackgroundColor: "#fff",
            data: sitesChart.ChartT2
        },
        {
            label: "Team3",
            fill: false,
            borderColor: sitesChart.Colors[2],
            pointBorderColor: sitesChart.Colors[2],
            pointBackgroundColor: "#fff",
            data: sitesChart.ChartT3
        }
        ]
    }

    // Line chart options.
    var options = {
        responsive: false,
        scaleOverride: true,
        scaleSteps: 10,
        scaleStepWidth: 10,
        scaleStartValue: 0,
        pointDotRadius: 7,
        datasetFill: false
    };


    var chart = $('#lineChart').get(0).getContext("2d");

    new Chart(chart, {
        type: 'line',
        data: data,
        options: options
    });

    return '';
}

$(document).ready(sitesChart.FieldRenderSetup());// JavaScript source code
Before applying:
After applying:


